
How to Report AEO Results to Your Executive Team Quarterly
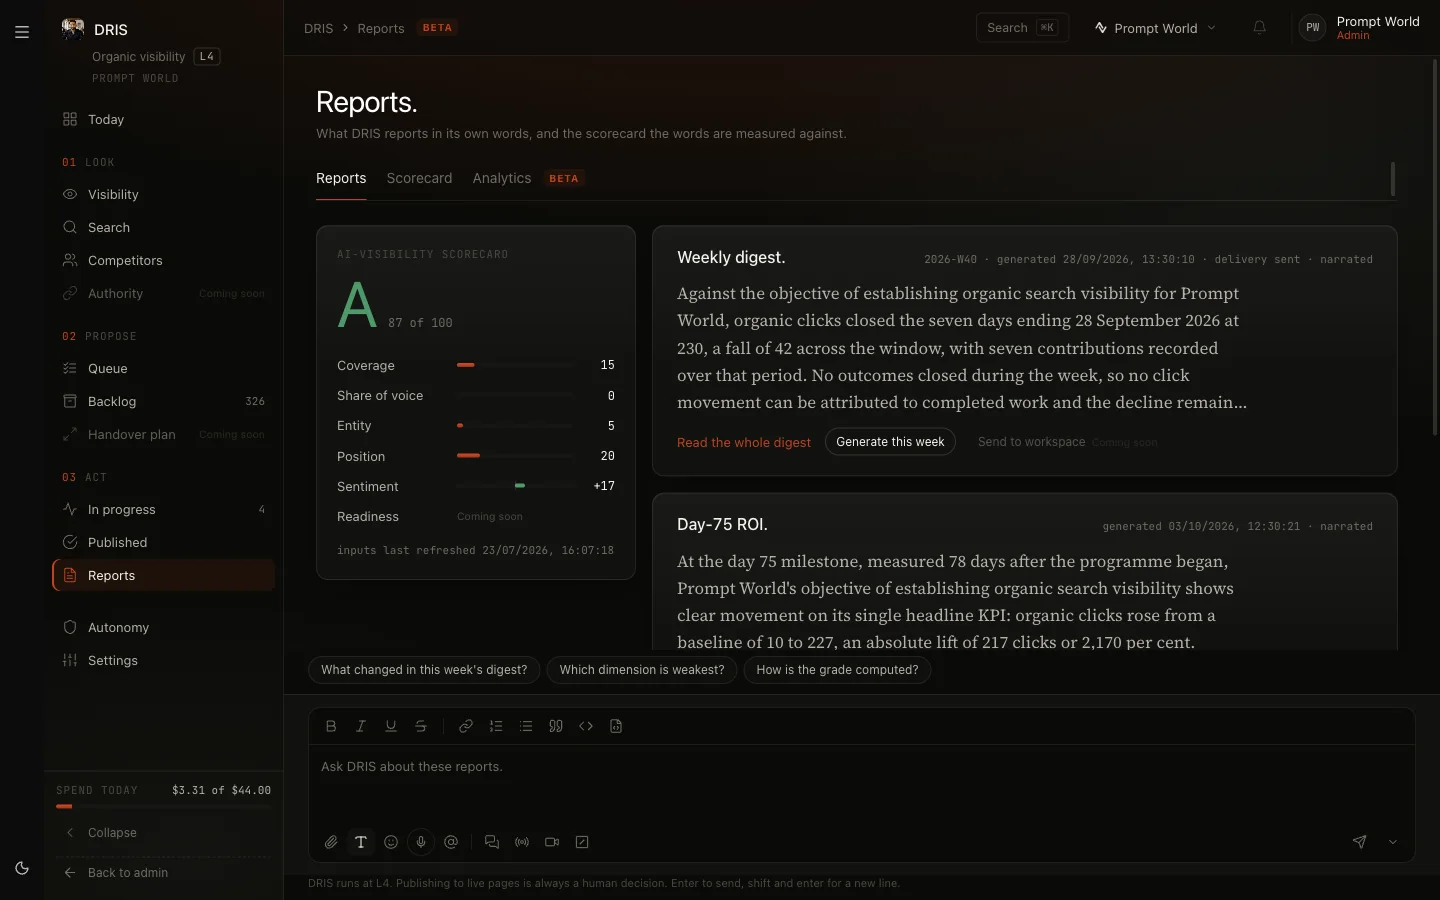
The best way to report AEO results to an executive team each quarter is one page: the objective you set and whether you are ahead, on target or behind; three numbers measured the same way every quarter, usually AI answer presence, citation share against named competitors and visits from answer engines; what you shipped and what moved; and the decision you need next. This guide covers the metrics, the structure, how to keep the numbers honest and how DRIS builds most of it for you.
What do executives actually want from an AEO report?
Answer engine optimization (AEO) is the work of getting ChatGPT, Claude, Gemini, Perplexity and Google's AI answers to name and cite your brand when buyers ask about your category. Executives don't need the mechanics. They need four answers:
Are we winning? A verdict against a goal they agreed to, not a pile of charts.
Against whom? Your share of AI answers compared with the competitors they already worry about.
Is it worth it? What the work cost and what it moved, in terms they can weigh against other spend.
What do you need from us? Budget, headcount, a page owner, a product decision.
If your report answers those four in the first half page, the rest is supporting evidence for the people who want it.
Which AEO metrics belong in a quarterly report?
Pick three headline numbers and keep them for the whole year. Changing the headline metric every quarter is the fastest way to lose a leadership team's trust. These are the metrics that hold up in a boardroom:
Metric: AI answer presence, What it tells an executive: How often the engines name or cite you on the questions your buyers ask, How to read it: Share of a fixed prompt set; compare quarter to quarter on the same set
Metric: Citation share, What it tells an executive: Your share of cited answers against the competitors you named, How to read it: Answers citing you over answers citing you or any listed competitor
Metric: Mention share, What it tells an executive: How often the answer text names you, linked or not, How to read it: Catches brand recall that citations miss
Metric: Prompts cited, What it tells an executive: How wide your coverage is across buyer questions, How to read it: Share of prompts with at least one answer citing you
Metric: AI-search referrals, What it tells an executive: Visits answer engines send to your site, How to read it: Sessions your analytics attributes to an answer engine's domain
Metric: Organic clicks, What it tells an executive: Whether classic search is holding while AI answers grow, How to read it: Context, not the headline, in an AEO report
A good default headline set is AI answer presence, citation share and AI-search referrals. The first says whether you show up, the second says whether you beat the competition and the third says whether it sends anyone.
Keep a short list of supporting numbers below the fold: fixes shipped, pages improved, prompts added, and the place your site holds among an answer's sources.
How should you structure the quarterly AEO report?
Use the same five sections every quarter, in this order:
The verdict. The objective in one line, with its baseline, target and date, and the call: ahead, on target or behind. Show the arithmetic in one sentence.
The three numbers. This quarter against last quarter and against the baseline, with the competitor comparison beside citation share.
What changed and why. Two or three movements worth explaining, each tied to work that shipped or to something outside your control, such as an engine changing how it sources answers.
What we shipped. The fixes and pages that went live, with how many needed a person's approval and how many were rolled back. This shows the work is governed, not just busy.
Next quarter and the ask. The top queued actions and the one decision you need from the room.
Put the method on a separate page: which engines, how many prompts, how often they were asked and what changed in the measurement. Most executives won't read it. The ones who do will trust everything else more because it's there.
How do you keep quarter-over-quarter AEO numbers honest?
AI answers vary from one run to the next, so AEO numbers are noisier than search rankings. Four habits keep a quarterly comparison fair:
Fix the prompt set. A trend only means something if the same questions were asked both quarters. When you add prompts, say so, and compare per answer rather than raw totals, because a bigger prompt panel collects more citations without you being any more visible.
Ask every engine the same way. Record which engine answered each prompt, and report by engine as well as in total. A gain on one engine can hide a loss on another.
Only call a change a change. Set a minimum sample and check whether the ranges for the two periods overlap. If they do, write "no clear change" instead of presenting noise as progress.
Flag measurement changes. If you changed your competitor list, your brand names or how share is counted, the report should say the new figure does not compare directly with the old one.
This is where most AEO reports go wrong. A screenshot of one good ChatGPT answer is not a result. A share measured on a fixed set of prompts, across engines, with the run count beside it, is.
How do you connect AEO results to revenue without overclaiming?
Be precise about what you can prove. Visits from answer engines show up in your analytics as sessions from domains such as chatgpt.com and perplexity.ai, and if conversions are tracked by source you can report what those sessions did. That is a real, defensible line.
What you usually cannot prove is that a citation caused a deal. Buyers read an AI answer, remember a name and come back through a branded search weeks later. Say that plainly, and frame the return as spend against measured visibility gain: what the program cost this quarter, what moved in presence, citation share and referrals, and the cost per fix that moved a number. Executives respect a report that knows its limits far more than one that inflates them.
What mistakes make AEO reports lose executive trust?
Too many metrics. Twelve charts tell leaders you haven't decided what matters.
Cherry-picked answers. One great answer from one engine on one day proves nothing.
A moving baseline. If the starting point changes, so does every claim of progress. Capture it once and keep it.
Activity dressed as outcome. "We published 30 pages" is effort. "Citation share moved against our two closest competitors" is a result.
No ask. A report that ends without a decision is a status update, and it will be skimmed.
How does DRIS help you build the quarterly AEO report?
DRIS leads organic visibility on Nagent's Marketing team and reports to MIRA, the AI Marketing Chief of Staff. He asks ChatGPT, Claude, Gemini, Perplexity and Grok what your buyers ask, records the exact prompt behind every citation and keeps the prompt set fixed per account so a trend means something. Most of the quarterly report comes straight out of him:
The verdict. You declare one objective, such as organic clicks or AI answer presence, with a target and a date. DRIS captures the baseline once, and it cannot be replaced. Today then grades the objective every month as ahead, on target or behind, with the arithmetic shown.
The numbers. Analytics shows citation share and mention share for you and each competitor on your list, split by engine, question, persona and intent, at 7, 28 and 90 days. A change is shown only when both periods have at least eight answers and their 95% ranges no longer overlap; otherwise it reads "no clear change".
The honesty checks. Citations are also shown per answer, beside the panel size, and the tile says so when the panel changed size between the two periods. Repeated samples and failed captures are left out.
The referrals. With Google Analytics connected, Traffic splits out the visits answer engines send.
What shipped. Every fix is a proposal with its reason, and publishing to a live page needs a person. The monthly report counts actions executed with their approvals and reversals.
The documents. Reports holds a weekly digest, a Day-75 ROI report and a monthly report, each downloadable as a Word file. The monthly report carries objective progress against baseline and target, citation share against named competitors, actions executed, the agent's accuracy record and next month's top queued actions.
There is no quarterly report button today. Take the three monthly reports for the quarter, lead with the objective's latest verdict and the 90-day Analytics view, and you have the one-page report above. The DRIS guide walks through each screen, and setting up DRIS covers connecting Search Console and Analytics so the numbers are real before the first report goes out.
For the rest of the picture, read the AEO metrics to include in an executive report, how to build an AEO ROI report and the AEO dashboard metrics that matter to executives.
Frequently Asked Questions
What KPIs should an AEO report include?
Lead with three: AI answer presence on a fixed prompt set, citation share against named competitors and visits from answer engines. Add mention share, prompts cited and organic clicks as supporting numbers, and keep the headline set the same all year.
How often should you report AEO results to leadership?
Quarterly works for an executive team, because AI answers vary from run to run and a quarter gives enough answers to see a real change. Track monthly inside the team, so the quarterly report is three months of checked numbers rather than one snapshot.
How do you measure AEO ROI?
Report what the program cost against what it measurably moved: presence, citation share and referral sessions, plus conversions from those sessions if your analytics tracks them by source. Don't claim pipeline from citations alone, since buyers often return through a branded search later.
Can AEO results be compared quarter to quarter?
Yes, if the prompt set, the engines and the competitor list stay the same, and you compare per answer rather than raw citation counts. When any of those change, say the new figure does not compare directly with the old one.
Report AEO results your executives will trust
A quarterly AEO report earns trust by being boring in the right ways: the same objective, the same three numbers, the same method, and a clear ask at the end. DRIS measures the answer engines the same way every week and grades your objective every month, so the quarterly page mostly writes itself.
Book a demo to see DRIS report on your own brand.